


Bot finds cold facts on ice sheet
 Print
Print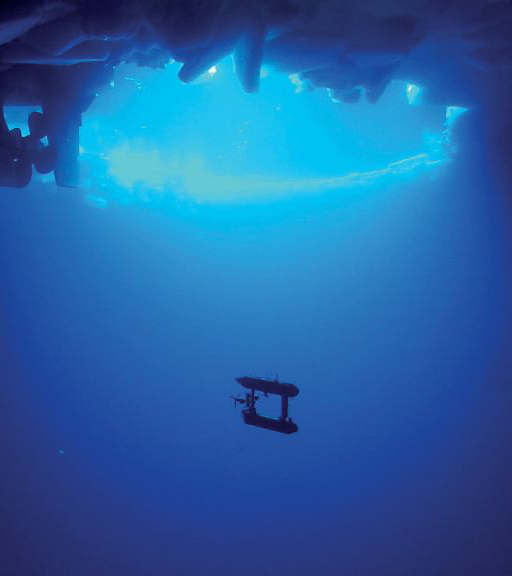 Australian scientists have used an underwater robot to show that Antarctic sea ice may be thicker than previously thought.
The Australian Government’s Antarctic Division’s project to the first detailed three-dimensional maps of Antarctic sea ice has come up with a number of intriguing findings.
It appears that the ice floes are much thicker and more variable than previous ship-based ice drilling measurements have shown.
“Over the two voyages, our teams covered some 500 000 square metres and mapped 10 ice floes, providing the most comprehensive and only high resolution three-dimensional view of sea ice structure to date,” said co-lead author of a new paper, Dr Guy Williams, from the Antarctic Climate and Ecosystems Cooperative Research Centre.
Much like its surface, the underside of sea ice is often covered with peaks, ridges, depressions and rubble fields, formed under high pressure by moving pack ice.
“Our maps revealed heavy ice deformation in all three study regions, producing a mean sea ice thickness well in excess of that typically observed from drilling data,” Dr Williams said.
“The mean thickness ranged from 1.4 to 5.5 metres, with the thickest ice measuring 16 metres.
“This technology will fill the gaps in ice thickness data collected by other methods and improve our understanding of the role of ice deformation in controlling total sea ice volume, and our ability to evaluate sea ice and climate models.”
An ‘autonomous underwater vehicle’ (AUV) used in the study was developed and deployed by the Woods Hole Oceanographic Institution in the United States.
The vehicle was equipped with an upward-looking multibeam sonar that recorded the structure of the under-ice surface by sending out a swath of ‘pings’ and measuring the amount of time it took for the sound to bounce back.
“We operated at a depth of 20 to 30 metres beneath the ice and drove the AUV in a lawnmower pattern across a 400 by 400 metre grid, with overlapping swaths,” Dr Williams said.
“This allowed us to map the ice thickness beneath the ocean surface at a resolution of better than 0.25 metres, which enabled us to discriminate individual ridge keels and rafted ice blocks.”
Scientist have typically measured sea ice thickness using ’point-based’ measurements, by drilling hundreds of holes in a floe and measuring the ice depth.
However, drill profiles can only be made in areas accessible by ship, are labour intensive, and tend to avoid the thickest ice. Satellite observations can measure large-scale thickness, but snow cover on the ice can make data interpretation difficult.
.jpg)